Intuitive Data at Your Fingertips
Access patient data from anywhere, on any device, in just a few clicks
Data Visualization for Clinical Care
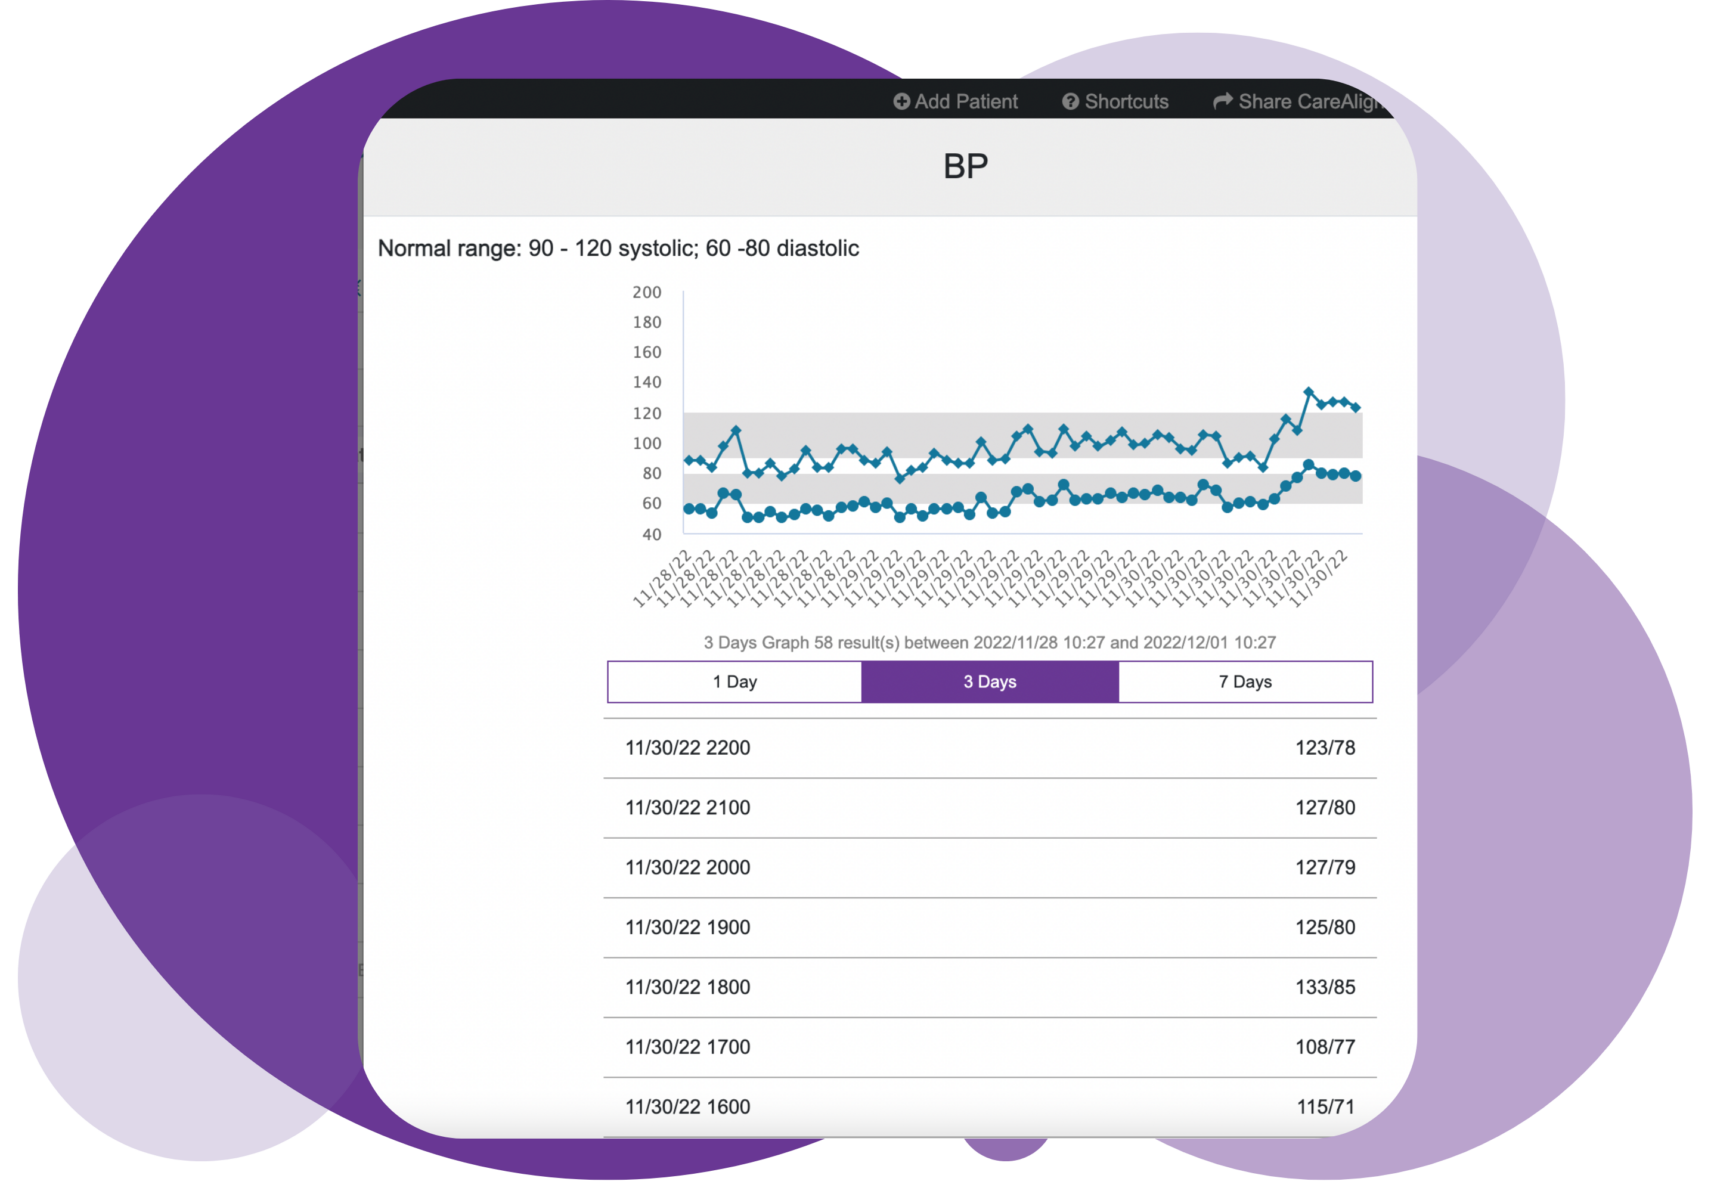
Information is power – and nothing is more powerful than making the right decision for your patients, because you have all of the information you need, when and where you need it.
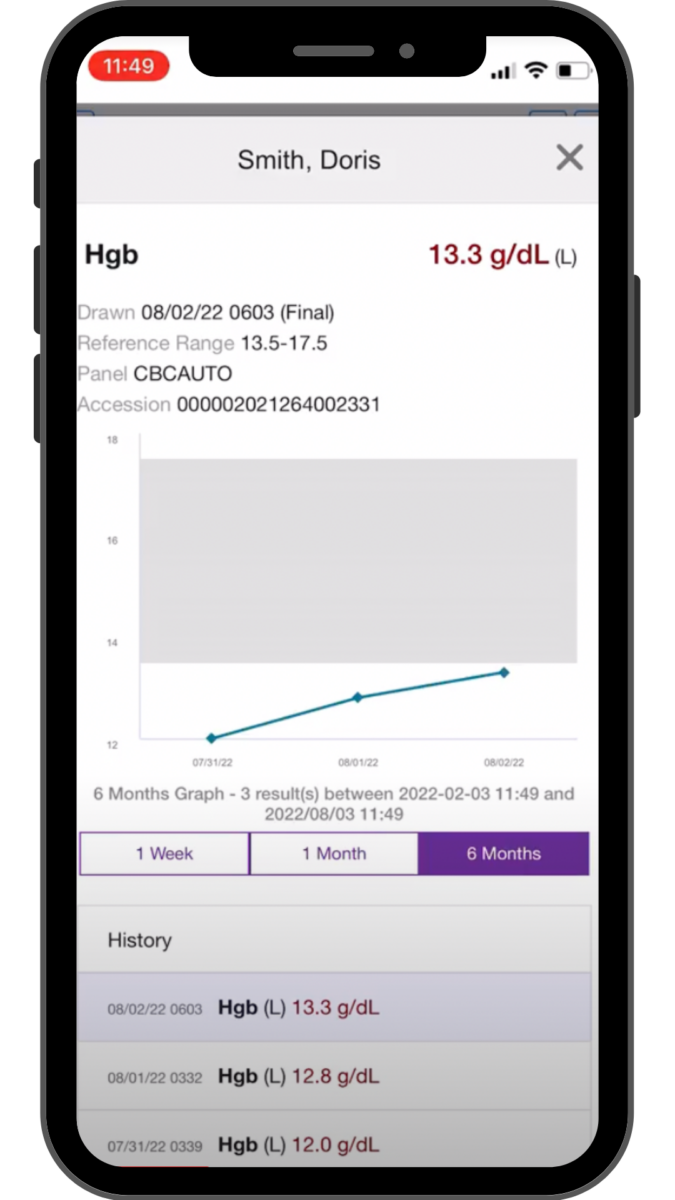
CareAlign’s Data Visualization module connects to any EHR to bring labs, vitals and medications to clinician’s fingertips. Trend lines, graphs, and searchable studies make it easy to get the full patient picture in minutes, without the frustrations of digging through piles and piles of data.
Data Views That Make Sense for Clinical Care
Vitals
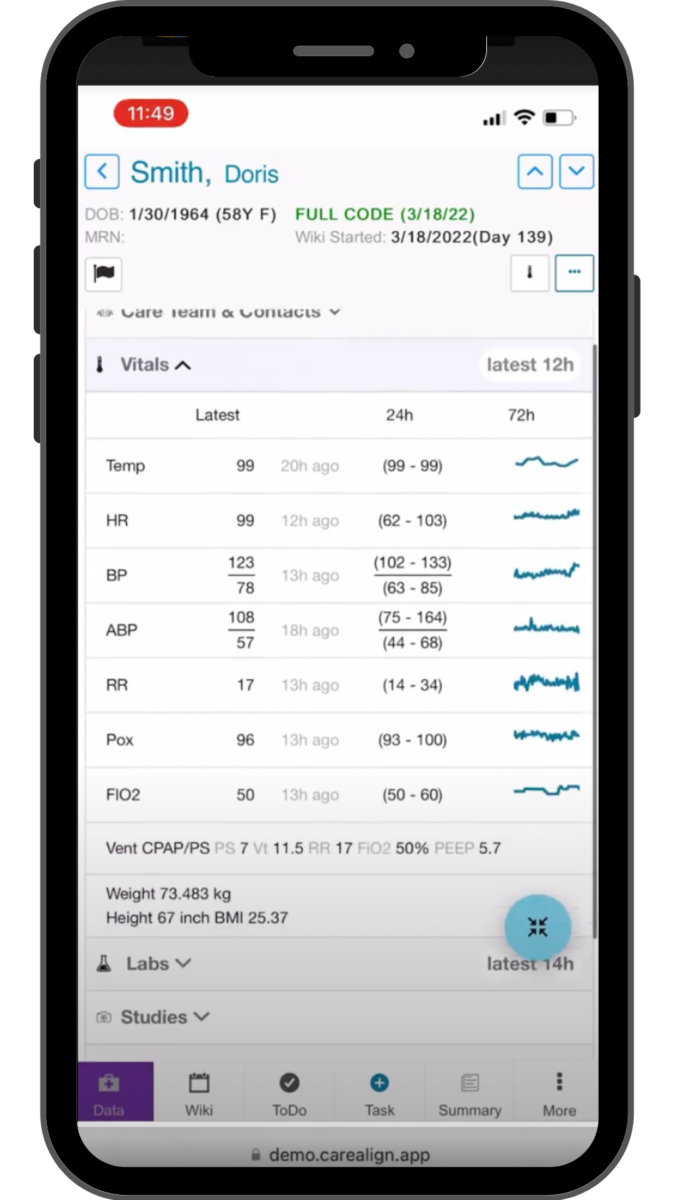
With two clicks, you can see your patients’ most recent temperature, heart rate, blood pressure, respirator rate, pulsox reading and FiO2. Easily catch any vitals worth digging into by looking at the 24 hour and 72 hour comparison.

Fishbone Lab Values
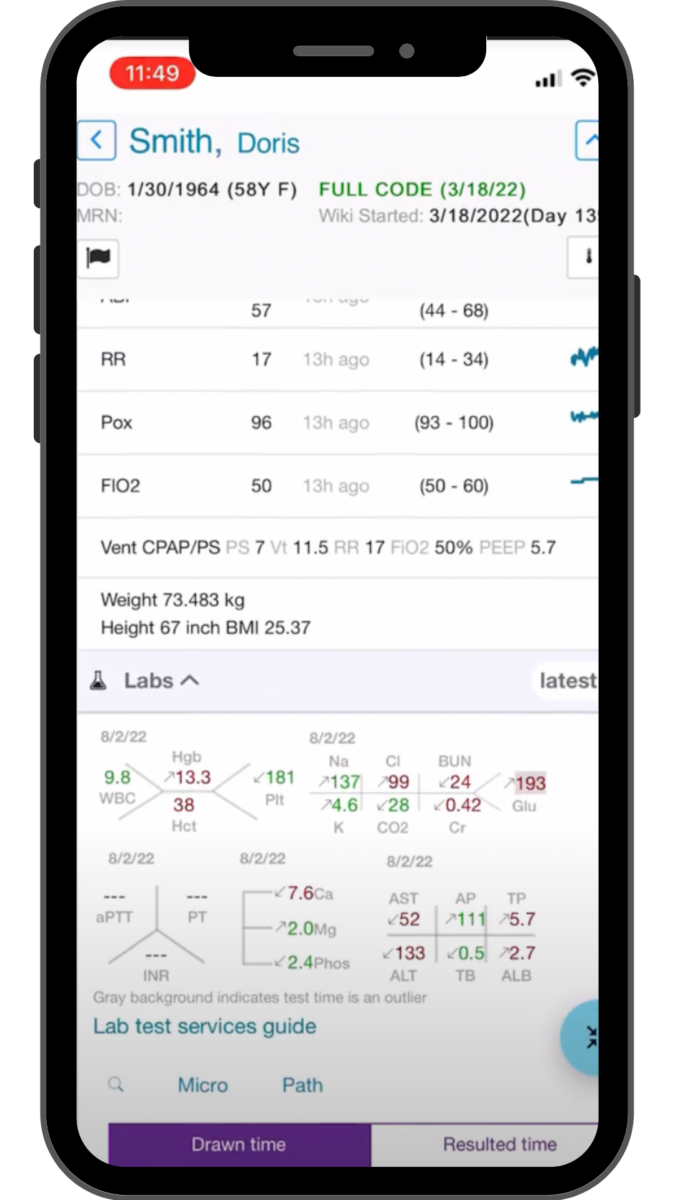
View lab values in an intuitive display to quickly and easily understand the results so you can provide the best care for your patient.

And More!
Compare new vitals with previous values to spot trends with trend lines. Manage medication lists, search for studies, view reports, and more with CareAlign’s intuitive data visualization.

Built To Deliver Better Care
![]()
Labs
![]()
Vitals
![]()
Medication Lists
![]()
Search Studies
![]()
Trend Lines
Learn More About CareAlign’s Other Modules
CareAlign Named to CB Insights Digital Health 150 List
CareAlign recognized for achievements in Care Coordination and Collaboration New York, December 7,...
Read More10 Must-Have Workflow Practices for Healthcare Organizations
Clinicians use many different clinical workflows in their typical work day. They see patients for...
Read More8 Meaningful Ways to Improve the Clinician Experience
Clinicians are central to healthcare. With increasing shortages, organizations need to find ways...
Read More


